| 20% disk | 44% disk | 60% disk | 85% disk | |||
 |
 |
 |
 |
|||
| Figure 3.
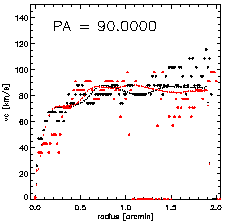
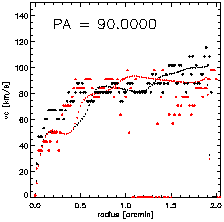
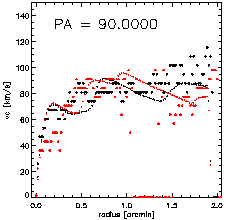
Comparison of observed (data points) and simulated (continuous lines) kinematics. Shown are results from different runs with variable disk-to-halo fraction*) for one slit position (90° black/270° red). As we decrease the importance of the disk, the velocity wiggles in the simulated rotation curves become less and less prominent. In the 85%-disk case we find velocity jumps of >30 km/s - more than we observe. The variations in the 20%-disk case already tend to be too small to successfully match with the observed data. *) The disk fraction is defined in the following way:
|
|
|||||